How Canadian housing thrived through the worst economy on record
The COVID19 pandemic made somewhat of a mockery of Canadian housing forecasts everywhere. You can’t entirely fault economists and other market observers (including yours truly). After all, how could the steepest economic downturn on record not lead to a negative outcome for real estate markets across the country?
The dynamics that caused an unprecedented housing boom during a near depression are complex but worth taking a few minutes to unpack. They offer insights into the important metrics to watch as the economy continues to heal and can also help inform us as to key measures to watch in the next downturn.
Below we look at a few of these key dynamics.
1) Job losses were steep but not for the income cohorts that drive housing demand
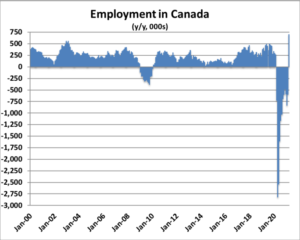
We have to start with jobs. In just two months from March to April 2020, Canada shed 3 MILLION jobs representing nearly 16% of all employment across the country. The hit to the labour market was 9 times greater in those two months than during the entire Financial Crisis.
But crucially, and initially overlooked by economists, higher income cohorts were virtually unaffected by the lockdowns. Over 40% of all employees in Canada earn more than $30/hour (or the salaried equivalent). This group saw employment decline by just 4% by April, quickly recover by June, and today stand 10% above levels seen at the onset of the pandemic.
In contrast, employees earning less than $20/hour, a group representing 33% of all employees, saw total employment fall 29% at peak and still today stand 19% below February 2020 levels:
 |
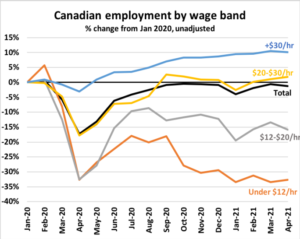 |
Put simply, the group of higher income earners that drive resale housing demand was not just unaffected by broad declines in the labour market, but actually saw their ranks swell during the pandemic.
2) Steep declines in GDP and labour income were (more than) offset by government transfers to households
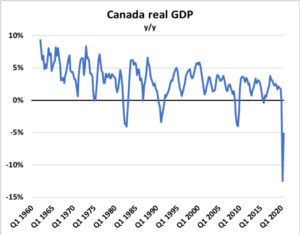
During the lockdowns in Q2 2020, Canadian GDP shrank 13% year-over-year (y/y). That decline was 3x greater than any other recorded drop on record. But during that same quarter, household disposable income growth surged nearly 16% y/y. The combination of a shrinking economy and rising household income was something never before experienced during a recession:
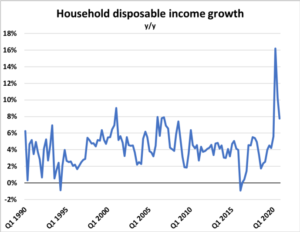
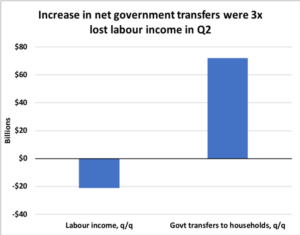
The reason for this surprising development was an unprecedented level of transfer payments from governments to households. In Q2 2020, labour income declined by $20B nationally. But at the same time, government transfers to households grew by over $70B. In other words, government income support programs paid out $3 for every $1 in lost income in that quarter. This level of government support was unparalleled in OECD countries, and it can be seen in the net swing in the federal deficit which was far larger in Canada than in any other developed country:

3) Households came out of the recession in better shape than they went in
Recessions typically lead to an impairment in balance sheets as households are forced to draw down savings or default on debt due to a decline in incomes across the economy. This recession was different in that households paid off debt and accumulated substantial savings throughout the recession. Among the key developments:
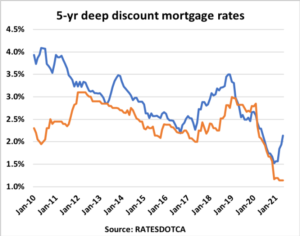
i) Interest rates fell to record lows
Aggressive actions from the Bank of Canada (BoC) to both slash the overnight rate and buy government bonds had the effect of pushing yields lower and led to record low fixed and variable mortgage rates by mid-2020:
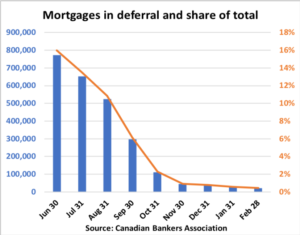
ii) Banks deferred payments on 16% of all mortgages in the country
Mortgage lenders were ordered to grant payment deferrals to borrowers who ran into financial difficulty. By June, nearly 800,000 households had deferred payments, representing 16% of all active mortgages in the country. This measure helped buy time for distressed borrowers and significantly improved cash flows:
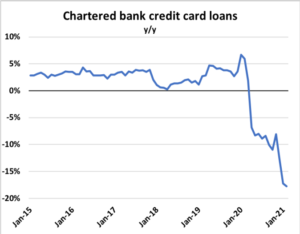
iii) Households paid off high interest credit card debt
Non-mortgage consumer loan balances declined throughout the pandemic. Notably, credit card balances at chartered banks have plunged an unprecedented 18% from peak levels.
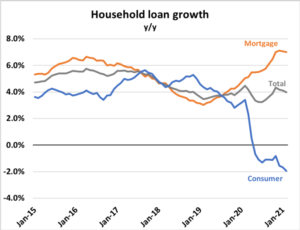
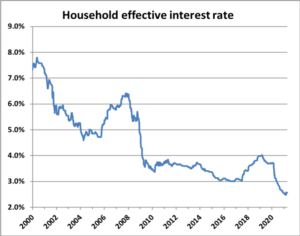
The general decline in rates coupled with the paydown of high interest credit card debt caused the effective household interest rate to fall to record lows. This measure captures the blended interest rate that households pay across all credit products. At the onset of the pandemic, it was 3.7%. Today it is closer to 2.5%:
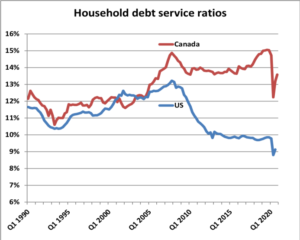
iv) Debt service ratios fell
Rising disposable incomes and a decline in interest costs led to a sharp improvement in the household debt service ratio. This ratio measures the share of disposable income that is consumed by debt repayment. Canadians entered the recession with this ratio at 30-year highs. It has since fallen to levels last seen in the mid-2000s:
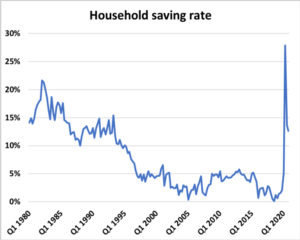
v) Savings surged
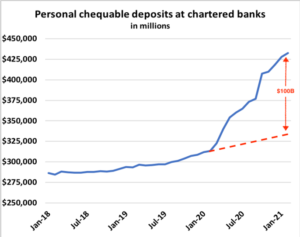
With strong income growth, lower debt payments, and fewer options to spend, the savings rate surged. It hit a high of 27% in Q2 2020 before falling to 13% in the most recent quarter. This compares to 1.5% at the start of 2020. Households are now sitting on over $100 billion in excess deposits in chartered bank checking accounts:
vi) Insolvencies plunged
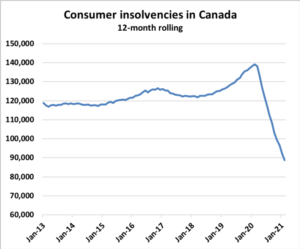
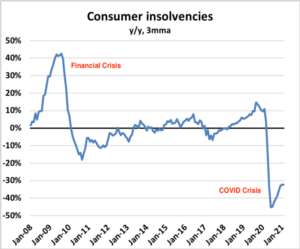
The combination of strong income growth, excess savings, household deleveraging, and the fact that courts were closed and creditors unable to obtain judgements meant that consumer insolvencies plunged and by mid-2020 were down nearly 50% y/y. This marked a dramatic departure from prior recessions like the Financial Crisis where insolvencies surged:
4) Slowing population growth primarily affected rental demand
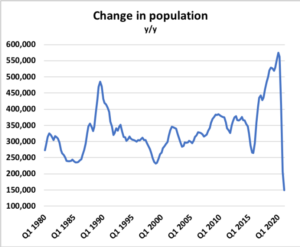
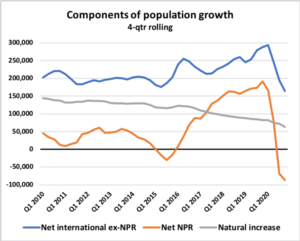
The closure of the border to international travelers led to a dramatic slowdown in population growth, which slowed to the lowest level on record in the most recent quarter. This was viewed as an ominous development for the resale market, but it didn’t prove to be the case.
If we deconstruct population growth into its main components, we find that the slowdown is almost entirely due to a steep decline in non-permanent residents (NPRs). This group is made up primarily of foreign students and work permit holders, and it skews heavily towards renters rather than homeowners:
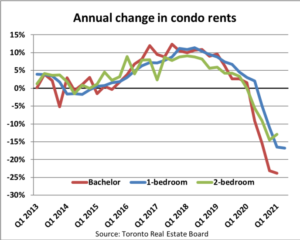
As a result, we did see softness in the rental market in major cities, notably in Toronto where condo rents fell 15-20% from peak levels and the vacancy rate for purpose-built rentals surged from 1% to 6%, but it never had the expected effect on resale demand:
5) The resale market was already in a strong seller’s market heading into COVID
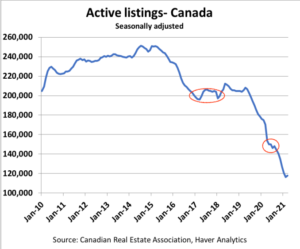
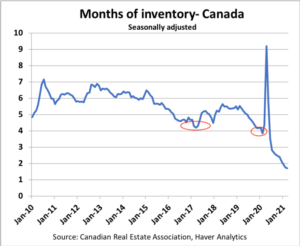
It’s easy to forget how strong the resale market was heading into the pandemic. Inventory levels nationally plunged throughout 2019, a fact now long forgotten. By the start of 2020, strong demand and persistently low supply meant that months of inventory (a key predictor of pricing trends) was already at record lows and well below levels seen in 2017 when strong price growth forced a slew of regulatory changes:
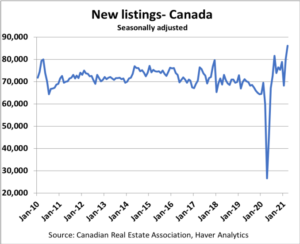
6) New supply initially plunged when COVID hit
Prospective sellers quite rationally chose to hold off listing their home during the pandemic. After all, who wants strangers wandering through your dwelling when there’s a novel pathogen making the rounds? The abrupt decline in new listings to 30-year lows further tightened what was already an inventory-constrained market:
7) Booming sales and shifting preferences for single-family dwellings could not be met with new supply
Higherincomehouseholdsfoundthemselvesflushwithcashandwithmorepurchasingpowerduetofallingrates. As more people began working from home and students transitioned to online learning, the demand for larger dwellings with more green space (ie suburban single-family) and secondary homes/cottages exploded.
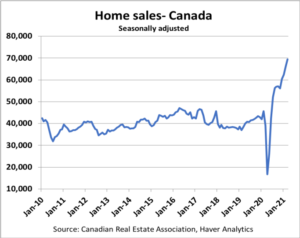
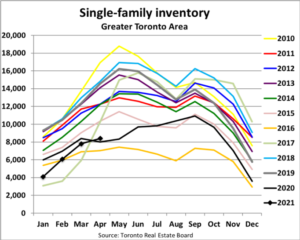
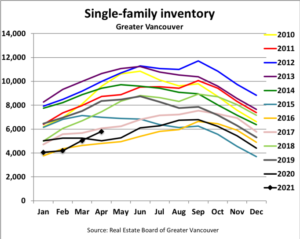
Inventory evaporated in resale markets across the country with most metros seeing single-family listings fall to near decade lows:
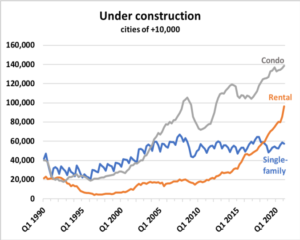
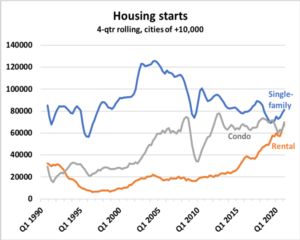
By mid-2020, housing starts began to rise as demand surged, but the single-family segment was only at 2/3 of the level seen in the early 2000s. And while there was a record number of dwellings under construction across the country, the number of single-family homes in the construction pipeline was effectively unchanged from mid-2000s levels. There was simply not enough of the “right kind” of new supply to match demand:
8) The end results: Surging single-family prices pushed real house prices to 50-yr highs
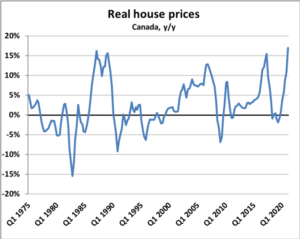
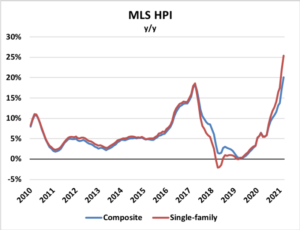
The net result was a surge in house prices nationally that was led by the single-family segment in suburban markets. This helped push real (inflation adjusted) house price growth to 50-year highs nationally:
This end outcome would have understandably seemed unthinkable to economists at the onset of the pandemic. It underscores both the highly dynamic and complex nature of the housing market and also the extent to which policy makers will go to soften the downturn and avoid a worst-case scenario.
